Logistic map - some undestanding
Some time back, I had put forth my view that a depiction of successive iterations of the logistic map will impart a better understanding of the (continuous :-) ) emergence of chaotic behaviour rather than a usual web diagram.
The map considered continues to be the logistic map something like:
So I went ahead and modified my toolset a little - and captured last five iteration in a iteration run of 30 iterations. I also sampled at a much smaller interval on the parameter (x). This did throw some light on the behaviour.
Ignore the depiction at the extreme ends of the graphs - I think its an artifact of the cspline fitting as there is an unstable fixed point at x=0.
In stable zone (r<3):

You can see that the at most of the x's there is no change in x and things settle down to the stable fixed point equal to
Even at r=3

you can see the oscillatory behaviour between two values (the bifurcation). Basically the successive iterator values stay at one value for some time, then jump to the other value and stay there for some more time and eventually jump back. The fixed point is no longer stable (note that the fixed point continues to be at (1 - 1/r) : only things stay there in an unstable way. And succcessive iterations keep oscillating around it. One value abve and one value below the stable point.
At some x values the behaviour of oscillation reverses - in the sense that at any given iteration, some disjoint ranges of x values are above the fixed point and the others its below the fixed point and then a few iterations later the rols have reversed. Those that were above have switched to the values stayed at by those that were below!
Now at successive r values upto r = 3.5 (Actually its not such a rational number : more actual irrational representation can be found at the math-world page)), there is a narrowing of the gap between the x ranges where the switchings of values I described above occur.
Two samples:


Now at r=3.5 similar behavior to the above happens but at a recursive level. Ther eis a finer split yielding four values but there is a "lower frequency wave" of switching between the values above the fixed point to the values below the fixed point. This recursion is also clearly visible in the standard bifurcation diagrams for the logistic map (one is up at the math word page).

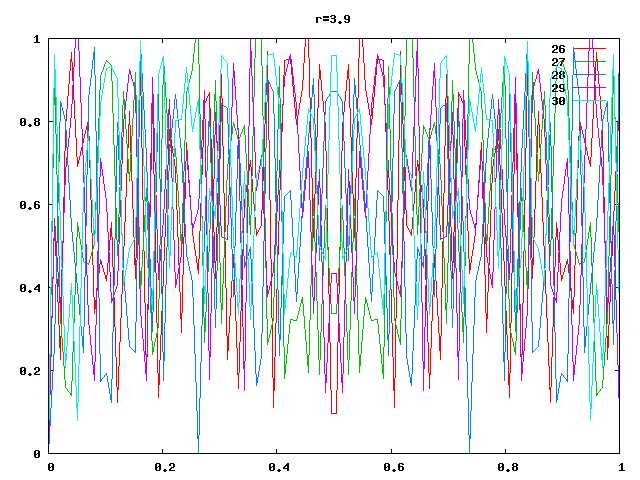
Now there is a critical r value at 3.5699.... and my tool skps to 3.6 but the rest of the stages are displayed below to impart of sense of the chaotic unsettling behaviour at each x with small zones where there is some settling into cycles and gradual weakening of that behaviour.


The map considered continues to be the logistic map something like:
x(n+1) = r * x(n) * {1 - x(n))So I went ahead and modified my toolset a little - and captured last five iteration in a iteration run of 30 iterations. I also sampled at a much smaller interval on the parameter (x). This did throw some light on the behaviour.
Ignore the depiction at the extreme ends of the graphs - I think its an artifact of the cspline fitting as there is an unstable fixed point at x=0.
In stable zone (r<3):

You can see that the at most of the x's there is no change in x and things settle down to the stable fixed point equal to
1 - 1/r.
Even at r=3

you can see the oscillatory behaviour between two values (the bifurcation). Basically the successive iterator values stay at one value for some time, then jump to the other value and stay there for some more time and eventually jump back. The fixed point is no longer stable (note that the fixed point continues to be at (1 - 1/r) : only things stay there in an unstable way. And succcessive iterations keep oscillating around it. One value abve and one value below the stable point.
At some x values the behaviour of oscillation reverses - in the sense that at any given iteration, some disjoint ranges of x values are above the fixed point and the others its below the fixed point and then a few iterations later the rols have reversed. Those that were above have switched to the values stayed at by those that were below!
Now at successive r values upto r = 3.5 (Actually its not such a rational number : more actual irrational representation can be found at the math-world page)), there is a narrowing of the gap between the x ranges where the switchings of values I described above occur.
Two samples:


Now at r=3.5 similar behavior to the above happens but at a recursive level. Ther eis a finer split yielding four values but there is a "lower frequency wave" of switching between the values above the fixed point to the values below the fixed point. This recursion is also clearly visible in the standard bifurcation diagrams for the logistic map (one is up at the math word page).

Now there is a critical r value at 3.5699.... and my tool skps to 3.6 but the rest of the stages are displayed below to impart of sense of the chaotic unsettling behaviour at each x with small zones where there is some settling into cycles and gradual weakening of that behaviour.


posted by Chandra at
8:28 AM
![]()
![]()

0 Comments:
Post a Comment
Subscribe to Post Comments [Atom]
<< Home