logistic maps 1(toolset)
I am studying a book by Prof N Kumar of RRI on deterministic chaos (University press, India ).
The chapter on logistic maps made me somewhat confused - so started an internet search. The booke deals with the web representation for discussing the works - bifurcations , etc.
Found an interestinng representation (non-web) at http://mathworld.wolfram.com/LogisticMap.html. See the graphs on the top. I dont have Mathematica - so what do I do to get the maps? I spent an hour and created the follwoing perl script which in turn lanuches gnuplot to make plots simialr to the ones at the web site - slightly deeper. (Ugh - I am on windows - linux did not work that great on my laptop).
Some images:
At r = 3.4
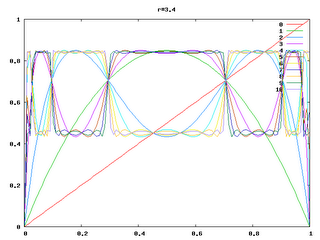
Perl Script :
Shell script plot.sh:
What do I learn from all this? Not much - nothing yet. I am tired for the day. Actul study postponed to another day.
The chapter on logistic maps made me somewhat confused - so started an internet search. The booke deals with the web representation for discussing the works - bifurcations , etc.
Found an interestinng representation (non-web) at http://mathworld.wolfram.com/LogisticMap.html. See the graphs on the top. I dont have Mathematica - so what do I do to get the maps? I spent an hour and created the follwoing perl script which in turn lanuches gnuplot to make plots simialr to the ones at the web site - slightly deeper. (Ugh - I am on windows - linux did not work that great on my laptop).
Some images:
At r = 3.4

Perl Script :
#!/usr/bin/perl


my $r_inc = 0.2;
my $x_inc = 0.001; #Change this to smaller values to get better  pictures

for(my $r = 2;$r <= 4;$r += $r_inc)
{
    my %data = ();

    for(my $x0 = 0; $x0 <= 1; $x0 += $x_inc)
    {
        my $x = $x0;

        for(my $i = 0; $i <= 10; $i++)
        {
            if(not defined $data{$i})
            {
                $data{$i} = [];
            }

            push @{$data{$i}},[$x0,$x];

            $x = f($r,$x);
        }

    }

    open SCR,">script_$r.scr";
    print SCR "set xrange [0:1]\nset yrange [0:1]\n";
    print SCR "set term png\nset output \"$r.png\"\nset title \"r=$r\"\nplot ";

    my $first = 1;
    foreach my $i (sort {$a <=> $b} (keys(%data)))
    {
        my $data_file = "data_".$r."_".$i.".dat";
        open OUT,">".$data_file;
        foreach my $x (@{$data{$i}})
        {
            print OUT "${$x}[0]\t${$x}[1]\n";
        }
        close(OUT);

        if(!$first)
        {
            print SCR ", ";
        }
        print SCR "\"$data_file\" title \"$i\" smooth csplines";
        $first = 0;
    }

    print SCR "\n";
    close SCR;

    system("./plot.sh script_$r.scr");
}

sub f
{
    my $r = shift;
    my $x = shift;

    return ($r * $x * (1-$x));
}
Shell script plot.sh:
#!/bin/bash

c:/Program\ Files/gnuplot/bin/wgnuplot.exe $*
What do I learn from all this? Not much - nothing yet. I am tired for the day. Actul study postponed to another day.
posted by Chandra at
11:40 PM
![]()
![]()

0 Comments:
Post a Comment
Subscribe to Post Comments [Atom]
<< Home